
We’re rather excited to say that we’ve completed our fifth year of peer-to-peer benchmarking for our firm. The good news? The data has a lot of terrific insights. The bad news? We’ve been told by the firm that does the annual benchmarking study that under no uncertain terms, we cannot name the firm that did the study or otherwise use any data from the study in any medium other than our own use. “Boo,” one might say.
So, while we appreciate [firm]’s commitment to performing industry benchmarking every year, we’re excited to share how we compare to [peers] without referencing any data other than our own. This, of course, may result in a lot of [vague] commentary, but we’re determined to share in the spirit of transparency just how well your financial planning firm is doing in comparison to the broader universe of Registered Investment Advisers. And we did ask [Firm] for their permission to share more, but as noted: no dice.
But with that apology in mind, let’s crack into the facts and figures!
2024 Firm Level Data
The study tracks data on a calendar year basis, so while the reality today may be slightly different, we’re happy to share where we ended up by the end of 2024 and to give you a peek at where we are so far year-to-date by the end of the blog.
To start, then, some figures as of the end of 2024:
- Client Households & Small Businesses: 184
- Year-End Total: 184
- Annual Growth Rate: 22%
- Retention Rate: 94.2%
- Clients Per Professional: 92
- Assets Under Management:
- Year-End Total: $78,552,651
- Annual Growth Rate: 36.9%*
- Assets Under Management Per Planner: $39,276,325.50
- Revenue:
- Year-End Total: $730,170.73
- Annual Growth Rate: 35.7%
- Revenue Per Planner: $365,085.36
*This is the aggregate growth of both investment returns, losses, client inflows, and client outflows. This is not a representation of investment performance.
Now, of course, all of this data is being shown here in isolation, and without the benchmarking data to compare to, leaves you a bit in the dark as to whether those figures are good, bad, or otherwise. For context, MY Wealth Planners is a state-registered Registered Investment Adviser. For a firm to be SEC-registered requires that they have more than $100 million dollars under management. So, while we’re close to that threshold, in industry terms, that makes MY Wealth Planners a very small firm. With the “small firm” idea in mind, let me share from my perspective and how I think about those figures.
First, with respect to the number of clients in general, we serve a lot more clients than most firms our size. While the study’s sponsors prohibit me from sharing their exact data, it wouldn’t be an exaggeration to say that we serve almost three times more than most firms in our category. What drives that? Well, the vast majority of firms have minimums that exceed $10,000 annually or have investment minimums of half a million or greater. MY Wealth Planners does have a minimum annual fee ($4,800 in 2025), but we’ve never stood on the ceremony of saying we can’t work with someone if they don’t have enough money to invest. In fact, we would attribute some of our 22% annual growth rate to that particular point.
You see, a lot of people have complex financial needs but aren’t just sitting on a giant pile of investable assets. Whether someone is a business owner and most of their net worth is tied up in their business, or likes to invest in more tangible assets such as real estate, or otherwise is simply an employee of a company and most of their wealth is tied up in the company 401(k) or pension, our service model of charging a monthly subscription makes us substantially more accessible to the public than firms with large investment minimums. However, what has helped us grow is also a bit of a detractor.
Financial industry studies have shown over the years that the more points of contact you have with a client in terms of services or products, the stickier the relationship. For example, a bank offering checking, savings, mortgages, auto loans, personal loans, HELOCs, investment management services, insurance brokerage services, and so on, has a multitude of ways to keep the relationship long term. However, for MY Wealth Planners as a fee-only financial planning firm, we really only have two particular points of contact: financial planning and investment management. Thus, while we have grown more rapidly than many of our peers over the past five years, the single-point-of-services some clients engage us for is also an easily removed service for those who were looking for a limited bit of help for a limited time.
In terms of our annual growth rate (remember the * before), I need to be emphatically clear: we do not, nor have we ever, claimed or accomplished a 36.9% investment return. Never. Not once. So when you read that our assets under management annual growth rate is 36.9%, that’s a figure inclusive of individual client returns and also new client investments. For reference, at the end of 2024 our client’s net investment in placing assets under our management totaled $61,848,546. If you subtract that off the year-end total from earlier, then we can safely claim to have grown our client’s investment assets by an aggregated $16,704,105 since the firm went independent in 2019. However, as you’ll see below, that hasn’t been a linear or otherwise smooth journey!
Finally, revenue. Simply put, revenue has grown a lot over the last five years. When I took the practice independent in October of 2019, our gross revenue for that year had been about $159,000. By the end of 2024, the firm generated 4.59x more revenue than it had generated before going independent; and not only had it done that solely through payments directly from clients, but in the absence of the conflicts of interest so often driving the higher revenue produced by fee-based or commission-based service providers. For better or worse, the demand for fee-only financial planning has genuinely driven an enormous amount of interest in MY Wealth Planners here in Longmont. To some extent, we could credit that with having had a de facto monopoly on local financial planning services for most of that five-year run, but as I try to tell my team: “A monopoly is not a growth strategy.”
Compared to 5 Years of Data
As already mentioned, MY Wealth Planners has participated in the [firm] annual benchmarking study since 2020, meaning that we now officially have 5-year compounding annual growth rates (“CAGR”) to review as well! So let’s take a look at the longer run of our performance as a firm.
Client Growth 5-Year Compounding Annual Growth Rate: 22.0%
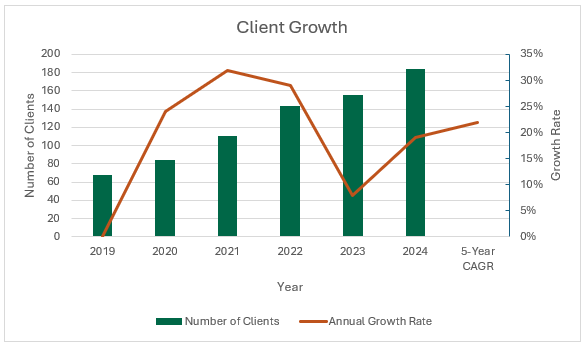
As you can see, client growth hasn’t been exactly a linear process. But, the first two years in business we grew our number of clients served by 25% and above, and though that percentage growth rate has tempered to a more reasonable tempo over the past few years, what you can see in the absolute number of clients is that we’ve onboarded about 20-30 clients a year for the past five years, resulting at an annual client growth rate of 22%.
Assets Under Management 5-Year Compounding Annual Growth Rate: 37%
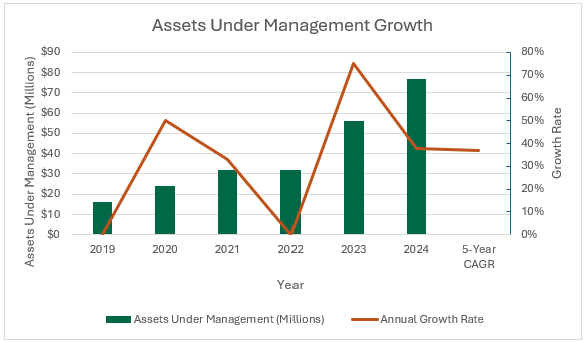
We bear in mind the * reminder before that the 37% annual growth rate over the past five years isn’t investment performance, but the round annual growth rate we’ve seen from investment returns, losses, and net flows from new and existing clients. A year like 2022 provides a stark reminder that while we were able to maintain effectively level assets year over year, a persistent down-trend that lasts almost a whole year can only be offset insofar as the confidence of clients to keep investing more during the downturn. Of course, this harks to the old expression that the stock market is the only marketplace in which people leave when things go on sale!
The growth rate here has been very healthy for a small practice, but it’s notable that while our revenue is not perfectly correlated to our assets under management, that our practice actually underwent an evolution over this five year period from a different set of service models to the models we currently offer. When we first went independent in 2019, the original service model from MY Wealth Planners was to offer a one time financial plan, from which someone could then subscribe to longer-term ongoing financial planning, and investment management was an optional add-on. As time has passed, we’ve gotten more focused in our target client and service model, and consequently today we essentially have three categories of client: legacy investment-only clients, bundled financial planning and investment management clients, and company retirement plan clients for whom we run plans such as the 401(k) or SIMPLE IRA for the employees.
Revenue 5-Year Compounding Annual Growth Rate: 37.7%
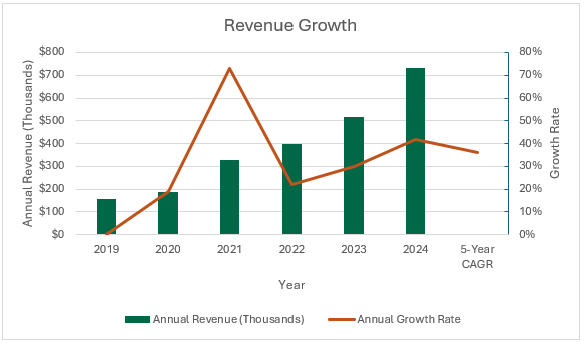
With the evolution of our service model in mind, you can see that our revenue has grown not-so-perfectly in tandem with our assets over the last five years. While revenue has grown at an incredibly healthy 37.7% on average for the past five years, it has taken a path we couldn’t quite have imagined. For example, when I first made an offer to then-summer-intern Samantha Rauch to come back to the firm after she graduated in 2020, the firm couldn’t actually have afforded to hire her back then. Fast forward to the spring of 2021, and the firm’s revenue had already outdone the firm’s revenue in 2020 and ended the year at almost double the revenue of 2020.
The very same odd experience occurred when we moved to our current office at 720 100 Year Party Court. At the time were looking at leases and negotiating terms, I was doing cash flow analysis weekly to ensure that an office that cost 3x more than what we currently had downtown was going to be manageable. By the time the lease was actually signed and we’d moved in, it wasn’t even an issue any longer, as the firm ended up growing revenue by more than $100,000 that year which more than made up for the difference; and even by the time we had reached the end of 2023, we’d already made the decision to onboard two more team members in 2024.
The Type of Client We Serve
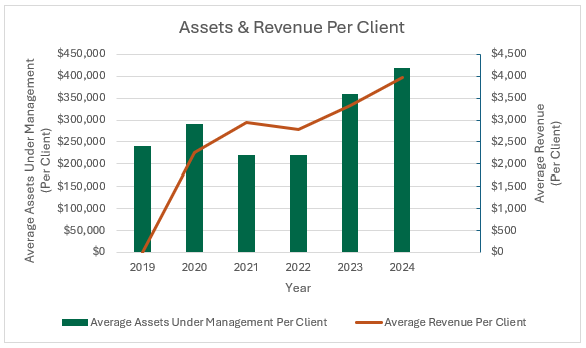
Today, we happily identify as a firm that more holistically serves clients above and beyond the normal “asset management” client focus of the wealth management industry at large. Consequently, while I’m still frustrated that we can’t share the actual peer-to-peer data, what I can say is that this chart tells you one story and omits another one entirely.
The story it tells is that over the years, the general affluence of the clients we serve has increased. This is reflected in both the average amount of liquid assets they place under our management, but also in the growth of the average fee clients pay to work with us. While some clients still fall below the firm minimum, the average fee paid by a client of the firm has almost doubled in the past five years. Call that fee confidence or simply increasing demand in the aforementioned monopoly, but the truth of the matter is that the firm has steadily attracted the interest of a more complex and technically challenging clientele. This delights me for business reasons, but moreso because as a financial planner I enjoy being consistently challenged in the practice of financial planning.
The story that’s not really being shown here, I will have to be vague about because of [reasons], but simply put, it’s that our scale is actually rather low relative to our peer group. While the exact datapoints cannot be shared, it’s noteworthy that despite the growing trust clients place in us for investments and the growing fee that we’ve been able to charge over the year, we still manage and charge at the lower end of assets and fees compared to our peer group. This is somewhat explained earlier by our willingness to serve clients with less liquid wealth than many other firms, but it still noteworthy in its contrast.
And in terms of whether our fee as a percentage of assets is high or low compared to our peers? Well again, we’ll have to be [vague] thanks to the benchmarking [firm]’s particular desire to keep things confidential and unshared, but suffice it to say, our fees don’t even end up on the bell curve of our peers until the investment accounts exceed $5 million. While the data shared in the image below isn’t drawn from the same benchmarking study, this gives you some idea as to where our fee levels fit within the competitive landscape.
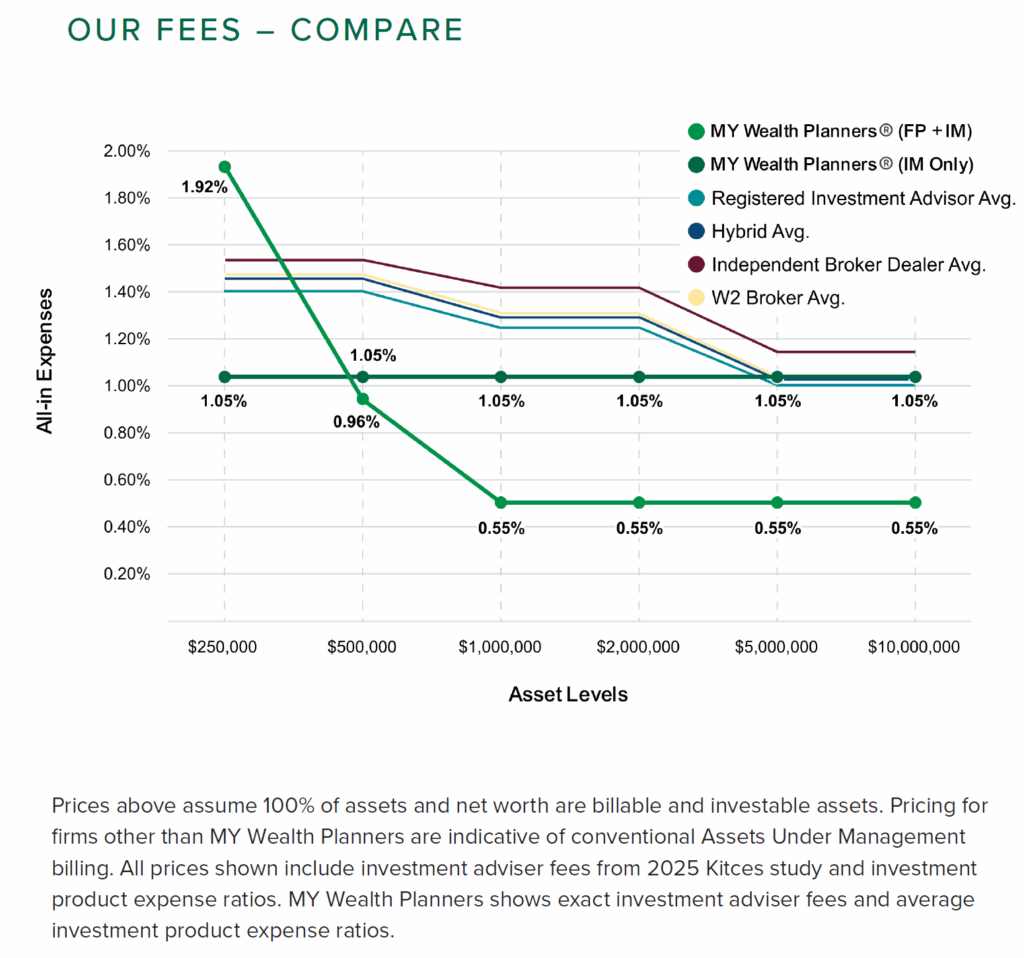
You might wonder about that last claim in light of the datapoint for “MY Wealth Planners® Financial Planning + Investment Management” at the $250,000 mark, but we’re accounting for our fee minimum, which is not a level datapoint we can ascribe to the entire universe of our peers.
Why Share What’s Behind the Curtain?
For a brief period of time in my career, I worked for IBM in their IT Services division, aka the “call center” division. Something that my original trainer drilled into me at the time was that IT Services should be like a magic box. “The customer calls IBM, we hear their problem, we do something on our end, and voila, the problem is solved.” From a customer experience standpoint, that makes some sense to me. “I call my service provider and tell them what’s wrong, and they fix it.” Wham, bam, done, simple. Onto the next call!
While I can appreciate the notion behind a magic box, I don’t believe in a magic box for personal finance. I think we’re all better when we can talk about money openly, whether that be personally or for our business. There’s an old expression that: “Comparison is the thief of joy,” but that assumes envy on the part of the comparer. What about comparison for the sake of understanding?
As financial planners, we value clients being open and transparent with us. We ask them to share their income, expenses, and the details of their financial assets. We ask them to share their hopes and dreams with us, and to confide their fears and doubts. That they do that for us is one of the keen pleasures and privileges we enjoy as financial planners. But in that spirit, I don’t believe in a magic box for financial planning. I believe that people should be able to trust just as much in their financial planner and know them just as well as their planner knows them.
In that spirit, we’ve shared how 2024 went as measured in the [firm] 2024 benchmarking study. In that same spirit, I’ll give you a peek at what we’re now sharing in the commons at the office. Feel free to take a gander next time you’re in.


Dr. Daniel M. Yerger is the President of MY Wealth Planners®, a fee-only financial planning firm serving Longmont, CO’s accomplished professionals.
Comments 4
Informative and interesting. Thank you.
Daniel,
I’ve always appreciated your transparency and candor. Thank you for sharing this.
Very interesting.
Well, it is obvious why the results are secret and why you are willing to share that information . . . your business is near the top (if not the top) – if my business was mediocre or worse, I would not want anyone publicizing that! Just saying . . .
Author
I appreciate it, Phyllis, but I think they are more concerned with protecting and controlling their data than letting us brag. We have strong metrics in many areas, but in industry terms metrics like our assets per client or revenue per client would be considered “bad,” though I’d happily argue that serving more people is a good thing. 🙂